Although this will be a long blog post, the essence of it is a single image,
which I'm hoping is all you need to know.
Here is the Big Idea, the Nested Venn Diagram:
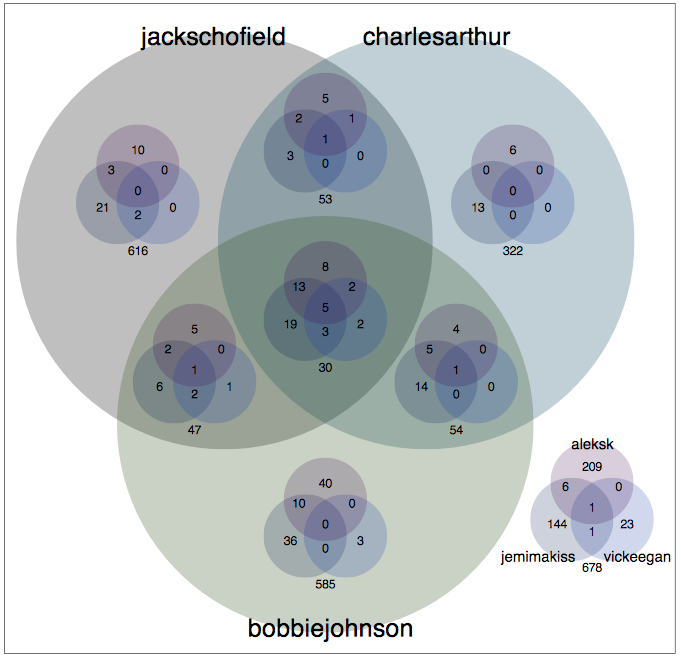
If the picture is immediately self-explanatory,
you need read no further; all else is mere elaboration,
and I am a happy man.
The six sets illustrated relate to the twitter users named
(all members of the Guardian Technology's team)
and the numbers in the intersections show the
number of people they follow in common.
At the centre, you will see that
Jack Schofield
(@jackschofield),
Charles Arthur
(@charlesarthur),
Bobbie Johnson
(@bobbiejohnson),
Aleks Krotoski
(@aleksk),
Jemima Kiss
(@jemimakiss),
and Victor Keegan
(@vickeegan)
follow five users in common.
Similarly, You can see that Aleks and Jemima follow
six
people
who none of the men do, and that the men all follow
two
who neither of Aleks or Jemima do.
(Note, this was as at 10th February 2009; obviously the following relationships
may change.)
If you want to find out who they follow in common,
tickery.net
which lets you look at the intersection of any set of
twitter users following relationships.
(The links above use Tickery.)
(Disclosure: Tickery is built by
FluidInfo on its wonderful
Fluid DB database;
I am a shareholder in and advisor to Fluidinfo Limited.)
The Back Story
A client wanted, among other things, a Venn Diagram to show the
which combinations of web sites a set of users visited.
This presented two challenges.
First, my software packages of choice
(Miro and Klee),
didn't technically support Venn Diagrams at the time of the request.
That, however, was easily solved; after all, it's just code.
The second problem was more serious.
The number of websites he wanted to illustrate was not two or three,
or even four, but six.
Six!
A six-dimensional Venn Diagram is a challenge.
I had a vague recollection that no lesser person than
Venn himself had come up with a construction that
in principle
allows an Venn Diagrams to be constructed in an arbitrary
number of dimensions.
But I also recalled that whenever I looked at such constructions,
my head hurt.
As Vic Reeves
might say, well over 99 per cent of all Venn Diagrams
in standard use show either two or three sets.
I have seen four;
I don't believe I have ever seen five used for anything other than
explaining how to construct a five-dimensional Venn Diagram.
If you're interested, here is Venn's constructions for five dimensions
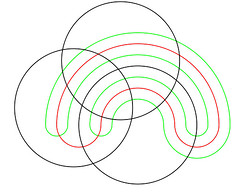
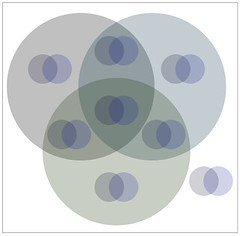
which compares to my nested venn diagram construction,
and here is his construction for six sets
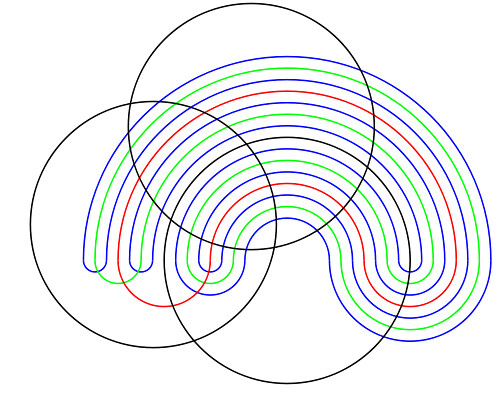
which compares to the nested Venn Diagram at the top of this article.
(The images illustrating Venn's constructions were lifted from
the Wikipedia article
on Venn Diagrams,
and were provided by
Kopophex.
Thanks, Kopophex.)
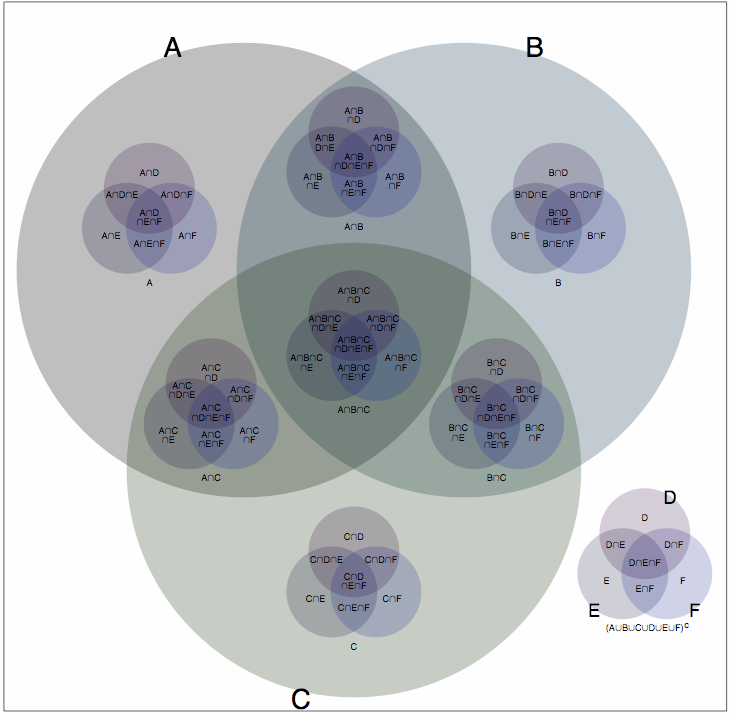
My solution, as you have probably gathered, is nesting.
The image below shows all sixty-four
possible memberships for six sets, which I have imaginatively
labelled A through F.
The large circles represent sets A, B and C;
each of the small Venn Diagrams represents sets D, E and F.
By placing a copy of the small Venn Diagram, in each of the
eight positions corresponding to the various intersections
of A, B, and C, we get a unique position on the diagram
for each of the 64 combinations of set memberships for A, B, C, D, E and F.
In case this isn't clear, here is a labelled version.
While this solution is far from perfect, so far the reaction from
colleagues and others seems to have been positive.
Certainly, I find this representation incomparably easier to digest
than Venn's clever-but-extremly-difficult-to-read versions.
And more significantly, on two occasions I have now gained insights
from using these that I had previously failed to elecit from the
data by alternative methods.
I will follow-up, as time and clients permit, with some examples
of their use.
Generalizing Further
It goes without saying that this technique can easily be generalized,
to nesting copies of any n-set Venn Diagram in the
various intersections of an N-set Venn diagram to yield a nested
Venn Diagram in (n + N) dimensions (i.e for n + N sets).
In principle, one could obviously go even further, nesting an
arbitrary number of levels, but I have severe doubts about the
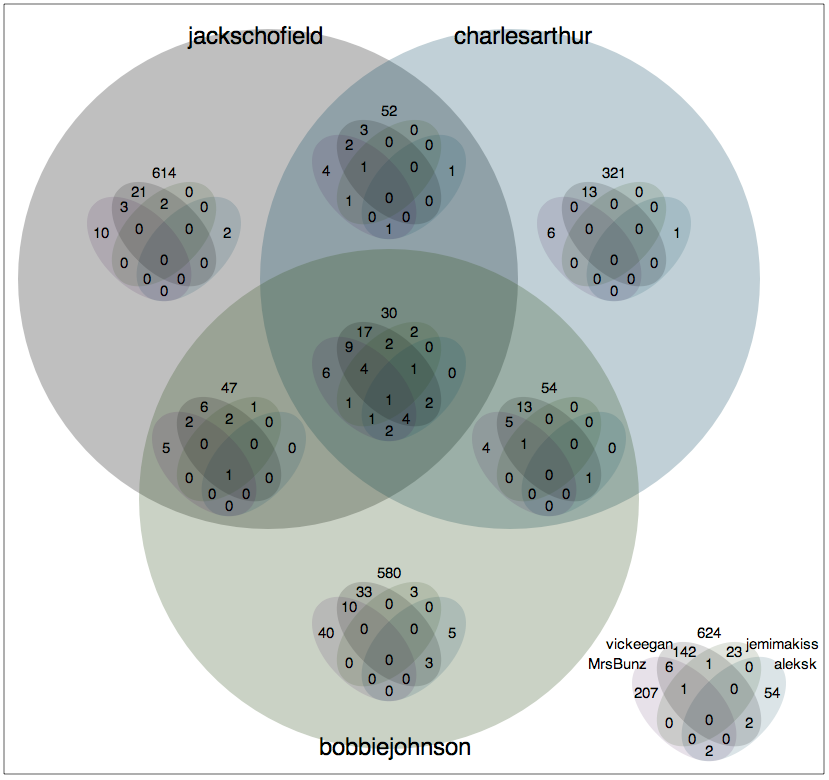
utility of nesting more than once. I had thought that six was probably
the largest number of dimensions (sets) the technique handles elegantly,
but in fact have now implemented versions for seven and eight sets.
Extending the Guardian Tech team to include its new member,
Mercedes Bunz (sic; @MrsBunz),
we get:
and adding in Kevin Anderson
@kevglobal,
we get to:
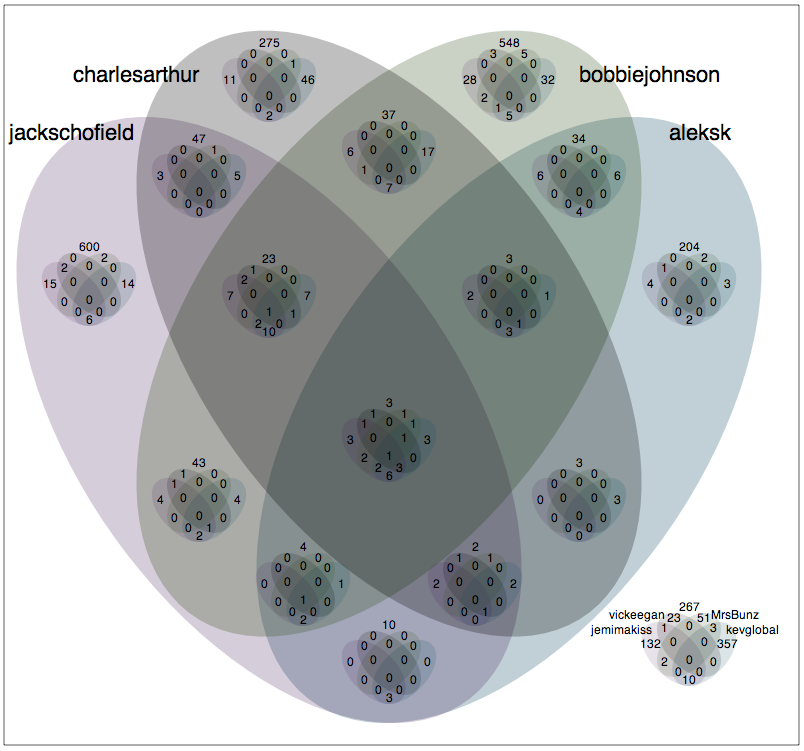
This obviously leaves just one question: who is the one person worthy
of being followed by all eight (of these) Guardian Technology writers?
You'll have to go to Tickery to find out.
Notes
for it was he, you will recall, who made the famous observation
that 88.2% of statistics are made up on the spot.
Labels: diagram, fluiddb, fluidinfo, graph, nested, tickery, twitter, venn, visualization, visualsation

