06 March 2009

Clustering Considered Harmful III: Commensurability

[This is the third in a planned series of posts on clustering that I'll publish over the coming period. The first part is here. When it's finished, I'll collect it all together into a properly printable paper.]

I have always found it surprising that the standard shorthand for a dubious or invalid comparison is apples and oranges. For while, granted, apples and oranges are different in many respects, they're not so different, and a comparison is not completely absurd. I would have thought that fruit flies and symphonies or physicists and personal computers3 or prime numbers and dictionaries might all present more obvious challenges as subjects for meaningful comparison. But perhaps that is the point: people would be unlikely to find themselves inadvertently trying to compare a fruit fly and a symphony4 whereas one can more easily imagine unwittingly comparing, say, a Cox's Orange Pippin with a Seville Orange.

There is a general problem with comparing, and in many cases with combining, so-called non-commensurate variables. The Shorter Oxford English Dictionary defines the adjective commensurate thus:

1. Having the same measure; coextensive. Const. with, to 1641.

2. Of corresponding extent or degree; proportionate, adequate. Const. to, with. 1649.

3. Corresponding in nature (with, to) – 1678.

4. = COMMENSURABLE 1 (rare) 1690.

At the risk of labouring the point, our three spatial dimensions are perfect examples of commensurate quantities: if we lay down an ordinary rectilinear x-y-z coordinate grid, there is a very strong sense in which going one mile parallel to the x-axis is equivalent to travelling one mile parallel to the y-axis or one mile parallel to the z-axis. A mile is a mile is a mile, and we feel very comfortable applying the notion of distance in an arbitrary direction and computing it in the usual Euclidean/Pythagorean manner.

We are on more treacherous ground when our dimensions consist of non-commensurate quantities, as only some of those who study or practise co-called cost-benefit analysis appear to be aware. For the approach of cost-benefit analysis requires us to express all the costs and all the benefits of some proposed course of action (or of some set of alternatives) in terms of a single numéraire—almost always money. Thus, when planning a motorway, we must express not only the financial cost in financial terms, but also such other diverse costs as habitat destruction, contribution to global warming, displacement of families from their homes, increases in pollutive emissions and likely increase in road traffic deaths in pounds, shillings and pence. Similarly, benefits must be expressed in cash terms. To do this, of course, requires suitable equivalences and conversion factors to be put in place (human life lost—£1 million; contestible contribution to possible making of planet uninhabitable by humans at some indeterminate point in the future—£2,452.13). This has led some cynics to suggest that cost-benefit analysis, as practised, is not so much a rational and objective way of collating all relevant evidence and drawing from it the optimal conclusion as a tool for justifying some desired outcome by careful manipulation of the many and infinitely negotiable parameters absolutely required in order for the method to function.

It will not have escaped the reader's attention that we have a similar problem with cluster analysis if we wish to apply it in situations where the factors to be considered as dimensions are not commensurate. Unfortunately, this is almost always the case in marketing, and it this non-commensurability of the inputs, and consequentially necessary setting of many essentially arbitrary conversion factors that forms the first objection to the common application of cluster analysis to customer database segmentation. The clusters that result from a clustering exercise are not merely dependent upon the equivalences and conversion factors chosen for the distance function, but are almost entirely determined by those choices.

As a minimum, this should cause us to treat with extreme scepticism the all-too-common suggestions that cluster analysis impartially and objectively uncovers inherent, underlying or intrinsic structure within the customer data. It might be more accurate to say that it allows the consequences of different choices of equivalence among input variables to be revealed through the mechanism of mapping a distance function to a cluster structure.

David Hand's Example

I'll close this post with a graphic illustration of the effect of scaling based on an example provided by David Hand.5 Consider clustering four points, A(–1, 10), B(1, 10), C(–1, –10) and D(1, –10), as sketched below.

Four points, in two vertically separated clusters.

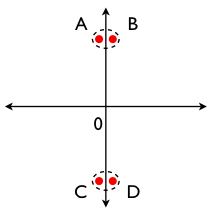
Clearly, points A and B form a cluster, as do points C and D. (The within-cluster distances are small and the between-cluster distances are large; these are defining characteristics of a good clustering.)

Now let us rescale, multiplying the x-coordinate by 10 and dividing the y-coordinate by the same amount. The result would be the following.

The same four points, in two horizontally separated clusters
after rescaling

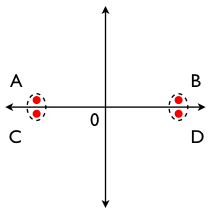
Now, clearly, points A and C form a cluster, while points B and D form another.

Or consider multiplying the original x-coordinate by 5 and dividing the original y-coordinate by 2. Now, our plot looks like this.

The same four points, in a square, after a further recaling;
the clusters are no longer in evidence.

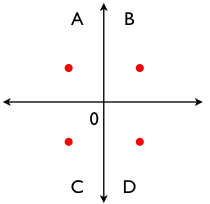
Our clusters have disappeared entirely!

To be clear, it is not my claim that clustering is always invalid or meaningless: if the variables were commensurate on the original scale, then A and B really do cluster, as do C and D. The point is that scale is crucial, and extremely problematical when for non-commensurate quantities.

Next up: direction (probably).

Notes

3 Though even as I write this I'm thinking Paul Dirac—definitely a Mac kind of a guy; very concerned with elegance and form; happy to do a few things well; a true hero among a narrow subset of scientists. I hesitate slightly at the prospect of nominating a physicist as the natural Wintel PC analogue, but sticking with fathers of the quantum theory, perhaps Nils Bohr, who arguably thought that the key thing was not to spend too long sweating the details like meaning and elegance but simply to get some computational tools into as many people's hands as possible to allow them to make some progress with the job in hand.

4 'How long is Drosophila melanogaster? Around 2.5mm you say. And Beethoven's Ninth? 74 minutes. Hmm. Let's convert those both to natural units using the speed of light, c as the conversion factor . . .'

5 Discrimination and Classification, D. J. Hand, John Wiley (Chichester), 1981.

Labels: , ,

03 March 2009

Clustering Considered Harmful II: Distance and Scaling

[This is the second in a planned series of posts on clustering (outlined here) that I'll publish over the coming period. When it's finished, I'll collect it all together into a properly printable paper.]

I said in the previous post that pretty much all you have to do to apply cluster analysis to a dataset is to pass in the coordinates of each point to be clustered. And this is the case when the points exist in Euclidean space or something similar—anywhere, in fact, where there is a well-defined, unambiguous and reasonable distance function (metric).

But whereas we can ordinarily agree the distance between each pair of objects in our solar system (at a given point in time), or indeed, between each pair of people on the earth ("as the crow flies"), defining the distance between a pair of customers in a customer database requires rather more decisions to be taken.

Numeric Variables with Common Units

First, even for those variables or dimensions that are ordinary numbers, there are potential questions of units and scaling. Even if all they are all expressed as units of a common currency (say, pounds sterling), there might be a question as to whether, for example, a difference of £1,000 in value of house (say between £248,000 and £249,000) is really equivalent to (say) a difference of £1,000 a month in interest payments (perhaps between £200 and £1,200); or indeed, whether it is useful to treat either of these as equivalent to a difference of £1,000 a month in change in savings balance (say between +£500 and –£500).

Numeric Variables with Different Units

There is even greater scope for argument when the variables measure fundamentally different kinds of things. Consider, for example, the variables number of children, and income. Suppose we measure these for four people as follows:

Customer  Number of children  Income
Ann 1 £15,000
Bianca 1 £40,000
Ciara 0 £15,000
Dee 3 £20,000

Which of Bianca, Ciara and Dee is closest to Ann? What is the appropriate conversion rate between number of children and income? There is, of course, no correct answer. It depends what we mean; and what we are trying to achieve.

Z-Scores

It is important to emphasize that the nature of the challenge here is not technical: there is no difficulty at all in devising conversion rates, and even rationales for those conversion rates. One particularly common approach is to compute so-called z-scores, by subtracting the population mean from each variable and dividing the result by the standard deviation, i.e.

z(x) = (x – μ) / σ.

While this approach unarguably provides an unique and unambiguous way of setting the determining a scale among numeric variables, it does rather seem to fly in the face of the very object of our exercise, which is to understand the inhomogeneities.

To illustrate why z-scores are not really a solution, suppose we were trying to cluster stars in our galaxy (space being a domain in which the three spatial dimensions clearly are commensurate). As is well known, the Milky Way is essentially a disc whose thickness is a mere thousand light years but whose diameter is some hundred times greater, i.e. roughly 100,000 light years. Let us suppose we place the origin of a (Euclidean) coordinate system at the centre of the galaxy, with x- and y-axes in the plane of its disc, and a z-axis perpendicular to it. Then, using the z-score approach, we would treat the average distance from the galactic centre perpendicular to the plane of the galaxy (presumably rather less than 250 light years) as being equivalent (in fact, equal) to the average distance from the centre in the plane of the disc, which we may suppose is more like 20,000 light years. Needless to say, this is madness.

Categorical Variables

While it is not necessary to run through every type of data that might occur, categorical variables are common enough to merit some discussion. Whether coded as numbers or strings, the defining characteristic of categorical data is that the values are unordered. Common examples in customer data include gender (typical values male; female) house type (flat; terraced; semi-detatched; detached) or last purchase (Film: Monty Python's Life of Brian (DVD); Book: The Unbearable Lightess of Being, Milan Kundera; Beverage: 70cl bottle of Ardbeg (10 yr) Single Malt Whisky). In some cases, the different values are all simply different—islands unto themselves—while in others they may fall into some (possibly partially ordered) structure such as a hierarchy; or indeed into several hierarchies.

When considering the distance between two members of our customer base, how then should we handle categorical data? And how should we combine categorical and non-categorical variables into a single, meaningful distance measure? Is the difference between a man and a woman zero, £1,000, 2.5 inches, 15lbs, 30 points of emotional intelligence or is the question too silly for words?

It is again important to be clear that the challenge is not technical. We can certainly use the discrete metric and simply say that if the two genders or house types or most recent purchases are the same, then the distance between them is zero, and if they are different it is one. But as before, it is hard not to feel that this solution is more satisfactory from the perspective of one who seeks to hammer the square peg of customer reality into the round hole of clustering than to a either a passionate or dispassionate inquisitor seeking truth and insight into her customers; it is the tidy-but-unhelpful bureaucrat's solution.

In the next part of this series, we will focus on the question of commensurability.

Labels: , ,

Clustering Considered Harmful: I. Introduction

[This is the first in a planned series of posts on clustering (outlined here) that I'll publish over the coming period. When it's finished, I'll collect it all together into a properly printable paper.]

Lumpiness

Wherever we look we see inhomogeneity. The universe is lumpy at all scales. Stars clump together as galaxies, galaxies form clusters, and clusters themselves cohere into superclusters. More locally, almost all the matter in our solar system is in the Sun; most of that which isn't is in Jupiter; and almost all the rest is tightly packed into other planets. Even towards the bottom, matter is lumpy, each atom being made up of a tiny sun-like nucleus surrounded mostly by empty space and a very diffuse cloud of point-like electrons.

People clump too. Rather than spreading ourselves out uniformly over the planet's landmass, we form dense populations in some areas (Monaco; Singapore; Bangladesh) and inhabit other places more sparsely (Greenland; Australia; Canada). Similarly, most countries have their high-density cities (Mumbai; Karachi; Lagos) and their sparse regions (the Gobi; Wyoming; the Rannoch Moor).

Truly, this is one lumpy universe.

Cluster Analysis

Cluster analysis is the name given to a collection of techniques for finding the clumps (or clusters). The idea is simply to make a list of the coordinates of the items of interest (the stars, the people or the atoms), possibly to set some parameters (like a target number of clusters), then to feed the list into the algorithm which divides it into groups—or "clusters". Typically, the clusters will be characterized by a cluster centre (the coordinate of some centre of gravity of its members), and perhaps some measures of compactness.

There are two main families of techniques for clustering: "bottom up" techniques start by assigning each point to its own cluster and then merge clusters in close proximity (so-called agglommerative or accretive methods), while "top-down" approaches begin by creating a single cluster and then look for ways to divide it and its children into ever smaller subclusters (so-called divisive approaches). There are interesting and bizarre variations, particularly so-called self-organizing maps, of which the Kohonen Network is a popular example with appealing properties.

Numerous algorithms exist, and many software packages, free and commercial, implement one or more. I will mention David Wishart's Clustan as a fine example, and David has applied his software and his approach widely, not least to the important problem of classifying single malt whiskies1 (though I personally favour an approach based more on repeated sampling without replacement . . .)

From Matter and Space to Customers and Marketing

Though I do not know, I imagine that somewhere in the not-too-distant mists of time, a marketer wanting to understand his (or her) customers must have read about cluster analysis and had the idea of applying it to his customer database. "After all," he perhaps reasoned, "we often think of the columns in our database as dimensions. Maybe, just as stars naturally clump together in space, customers naturally cluster in the virtual hyperspace of my database; and if so, perhaps cluster analysis could help me to uncover the natural, intrinsic, underlying structure within my customer base. Separating my customers into their natural groups," he may have continued to reason, "will surely help me to design marketing programmes that are well tuned to their different needs, attitudes, aspirations and behaviours."

Whether it happened quite like this or not, certainly it has become a practice among some marketers to do just this. The rest of this series will critically examine this approach and (ultimately) argue that there are some fairly major challenges and problems with the application of clustering methods to customer databases, and that companies' interests would often be better served by alternative, and more direct approaches.

In the next part of this series (now published!), we will focus on the questions of distance and scaling.

Notes

1 Whisky Classified. David Wishart, Pavilion Books, (London) 2006.

Labels: , ,