Marketing Micro.Blog
- Rely more on viral and (incentivized) referral marketing than on paid advertising.
- Go after authors and other (professional) writers, who seem like a perfect fit for the platform
- Create specific material for people thinking of switching from Twitter to Mastodon, explaining the relationship between Micro.blog, Mastodon, the Fediverse and Twitter, and emphasizing what's different about Micro.blog.
- Make the client software more obvious on the Micro.blog website; at the moment they're kind of buried in the Help pages.
- Before you even consider paid marketing, analyse your existing sign-up, conversion and usage data and get set up to do that consistently. If you don't have historical data, start capturing it immediately: history starts with your oldest data (as my friend, David Townsend, taught me).
- If you do paid advertising, consider not giving incentives as part of the promotion; if you do give discounts, be careful interpreting the results of the campaign.
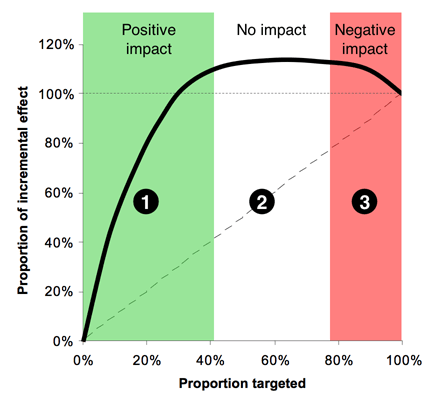
- Be aware of negative effects in marketing (which, although relatively unlikely in your case, are more widespread than is commonly accepted). See
Background
Micro.blog is an excellent Twitter alternative (inter alia) created by Manton Reece, who is a deep thinker about social media, and has written book about Indie Microblogging. Micro.blog was launched in 2017, as both a blogging platform (with a particular, but non-exclusive focus on title-less, “microposts”, as well as full blog posts), and has expanded to include hosting podcasts, photos, “book shelves” and more.Micro.blog is a first-class member of the Fediverse, in the sense it supports ActivityPub, meaning that you can follow and be followed by Mastodon users from Micro.blog. Manton deliberately eschews many of the Twitter features that Manton thinks have contributed to its becoming a toxic platform from many users. For example, it has no equivalent of retweeting, does not encourage use of hashtags, does not use an algorithmic timeline, does not show the numbers of followers and account has, does not carry advertising, and has active community management, with Jean MacDonald (@jean@micro.blog) employed as its community manager.
Micro.blog has an open API, allowing people to create accounts and post without paying, and also to link one or more external blogs to Micro.blog, but most users subscribe either to its $5/month hosted microblog plan, or its $10/month Micro.blog Premium plan, which includes podcasting, video, bookmarks and (sending) newsletters.
It's slightly ironic that I am not, in fact, a very active user of Micro.blog, for somewhat obscure reasons, but I am an enthusiast for the platform and have followed its development and growth since before the Kickstarter campaign Manton used to launch it. (The reason I don't use it much as is that I've been taking advantage of its open nature as a way to allow to experiment with hosting a microblog and blog on my own weird tag-based database, microdb, and because I don't work much on that, posting to it is actually a bit of palava for me. I also, already, have blogs on way too many platforms (e.g. this Scientific Marketer Blog on Blogger, the Test-Driven Data Analysis Blog on Github Pages (with Pelican), various List blogs and prose blogs on Eric Bower's fascinating list.sh and prose.sh, SSH/PKI-based platforms under the pico.sh umbrella. All of these effectively syndicate through my micro.blog/njr account.) (Pretty good that you call do all that, huh?)
Marketing Micro.Blog
On Episode 541 of Core Intuition, Manton and Daniel discussed how to market Micro.blog, and mentioned that their community manager, Jean MacDonald, always emphasizes that, if they do, they need to measure the impact (which is obviously right).
As someone who has worked a lot in marketing (not the adtech, surveillance capitalism kind, but the sort of direct marketing most businesses need to do), I have thoughts. Here I'll expand on the TL;DR above.
- Viral and (incentivized) referral marketing. Social media is viral by nature, and current (active) users are generally the best ambassadors for the platform. I would have thought that further encouraging members to promote the platform by giving them discounts (probably free months/credit on their plan) when someone else signs up for a paid account would be a highly efficient way of using the existing community. I suspect the incentive would not have to be a lot: a single extra month on whatever plan you're on if someone signs up using your code seems plenty.
- Go after authors and writers.
There was some talk on the podcast about celebrities like
Elton John, and Manton commented that there are no music-related
features on the platform (though as Daniel keeps pointing out,
it wouldn't take much to extend bookshelves to record shelves,
film shelves etc.)
But Micro.blog does have a special focus, it seems to me—writing and books. First, unlike Twitter and Mastodon, there is no limit to post length on Micro.blog. If you go past the maximum micro-post length (280 characters), only the first part is shown and you have to click a link to see the full post; and full blog posts with titles just show as links in the timeline. But despite the name, Manton absolutey sees Micro.blog as a full-blown blogging platform. (This confused me for ages, and the name still seems odd, to me, for a platform that supports micro-posts and full blog posts; but naming is hard.)
More than this, Manton loves books, has built a special Bookshelves feature for tracking what you're reading. Manton has also added the ability to send out your posts as email newsletters, as well as publishing them to the web.
It seems to me that the ideal people to attract to Micro.blog are writers. I don't know what the best way to do this is, but probably just reaching out to some (and probably offering free accounts, I guess) would be a great start. If a few (more?) novellists, poets, and essayists joined the platform, I would have thought that would both further raise its tone and potentially attract many of their readers.
- Create specific material for people thinking of switching
from Twitter to the Fediverse.
Unsurprisingly, there is a
help article
on Micro.blog called
What’s the difference between Micro.blog and Twitter?
That's great, and is needed more than ever.
But there's not an article called
What’s the difference between Micro.blog and Mastodon?
I think creating one is important, ideally emphasizing many of
same things as the article contrasting with Twitter does,
but also more specifically highlighting the significant differences
between Mastodon specifically, and the Fediverse
more generally, while simultanously getting the message across
that you can be a first-class participant in the Fediverse
on Micro.blog.
And of course, that help article shouldn't just be buried in the help: it should be a blog post, linked from the front page, and promoted to high heaven, especially to all the people now writing articles about Mastodon and the Fediverse. (And writers!)
- Highlight the client software more.
Although it wasn't hard to find, I was slightly surprised, today,
how long it took me to find the Mac client for Micro.blog, which
I didn't have on the particular machine I'm writing on.
It isn't in the Mac App store (which is fine),
but it also isn't (I think) mentioned on the front page
of the site, isn't very prominent in the help,
and when you log in on the web, there isn't even an understated
call to action suggesting you might want to try a native client.
This is true on mobile too.
While there's nothing wrong with using Micro.blog through a web browser, many (most?) people choose to interact with it, as with other social media platforms, through a client app. And there are lots. (Two of Manton's commendable attitudes are (1) that he is a huge enthusiast for the web in general, and the indieweb in particular, and (2) that he is deeply committed to letting a thousand client flowers bloom, and doesn't privilege the apps Micro.blog itself produces.)
But it wouldn't hurt to let people know.
It's not like they're trying to hide it. There's a great (anchorless) section of the Micro.blog help site highlighting (at the time of writing) nine apps you can use with the service. But you have to go looking.
- Measure before you market.
As noted above, Jean apparently encourages Manton to put in place
good measurement before embarking on (paid) marketing, which is
obviously sound advice. As much of the content in other articles
on this blog
emphasize, these measurements are quite hard, but important.
Possibly less obvious is that you need a good baseline set of measurements before you start. Micro.blog may already track sign-up rates (for trials), conversion rates, upgrade rates, retention (renewal rates)/churn etc., but I don't ever really remember hearing Manton talk about it on Core Intution, so possibly not. Even if no one at Micro.blog already does this, I would think there's a good possibility enough data is kept to be able to analyse many of these things retrospectively. I would strongly recommend building at least basic stats for these things and going back and graphing them over the whole history of the platform if possible. This will (a) be useful in itself and (b) set the company up for measuring marketing more effectively. (Needless to say, the measurement should be ongoing and ideally automated to produce some kind of report or dashboard, either on-demand or as something computed routinely.)
- Be careful with incentives.
I am definitely not advising against paying for promotional marketing;
but I am suggesting that there will probably be a better return
on investment from all the things above for lower cost than any
likely ROI on direct/promotional paid marketing.
If Micro.blog does decide to do promotional marketing—for example,
by sponsoring podcasts, as discussed on the show—there are two
important things to bear in mind:
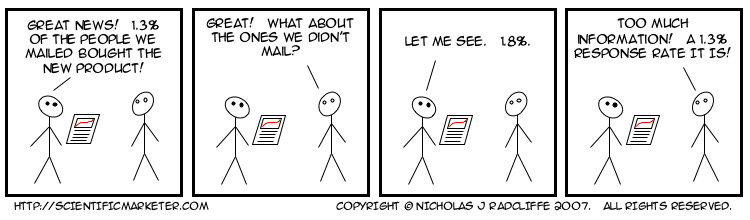
- Even if you use a code to track where people came from, that does not prove that they are incremental sign-ups or sales. Of course, it's quite strong evidence (and even stronger evidence that they probably heard the promotion), but some people will (do!) use promo codes who would have bought anyway.
- This is particularly true if the promotion comes with some kind of discount or incentive—a 30-day instead of a 10-day trial; 12 months for the price of 10; whatever. For example, if someone I know wants a cloud-based server, I will definitely direct them to Linode (because they're excellent), but I'll point them to one of podcasts with codes offering $100 free credit, because: well, why not? This is fine: I'm sure Linode is happy to give people the $100 to sign them up, just as I'm sure Manton is happy for them to get a discount. But it does affect the measurement of incrementality, and the bigger the incentive (and the $100 from Linode is huge), the more likely it is to affect assessment of incrementality (and, therefore, ROI).
Needless to say, having good historical measurements allows you also to offset some of this, because if signups are fairly steady you should see the aggregate effect of promotional marketing.
- Be aware of negative effects.
My final caution probably isn't highly salient for Micro.blog,
but is important for all marketers to understand:
marketing can, and does, have negative as well as positive
effects.
Unfortunately, there's an Upton Sinclair aspect to this:
“It is difficult to get a man to understand something, when his salary depends on his not understanding it.” — Upton Sinclair, I, Candidate for Governor: And How I Got Licked.
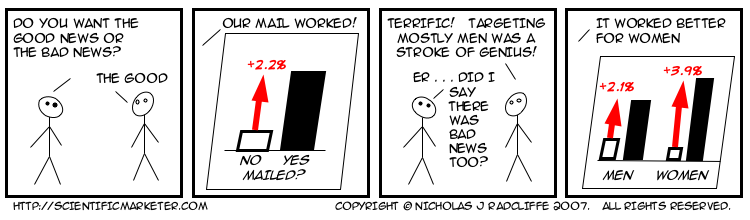
Marketers tend to assume that the worst that can happen in a marketing campaign is that it costs money and has no impact. In fact, the truth is much harsher: it is perfectly possible to spend good money to drive customers away. In fact, it's common. Usually, there's a mix, with a few people being put off, and more people being turned on, so that there's a net benefit. It takes fairly inept marketing to generate a net negative effect in overall behaviour.
One case, however, where this is extremely common is retention activity. I've written about this extensively, for example in this paper on churn reduction in mobile telephony. The basic gist is that people who leave are generally getting poor value for money, poor service, are not using the product or have had a bad experience: often they remain paying customers mostly out of apathy, laziness or because they don't realise they're out of contract. Calling them up and offering them the chance to lock in again often acts as a catalyst for cancellation. (“Really? I'm out of contract. Does that mean I can cancel right now?”) I'm not for a moment suggesting there are hoards of Micro.blog customers only paying subscriptions because they've forgotten about them or can't remember how to cancel. But you never know: there might be a couple!
Labels: advertising, marketing, measurement, negative effects, response, uplift
posted by njr at 21:15 PERMALINK
![]()
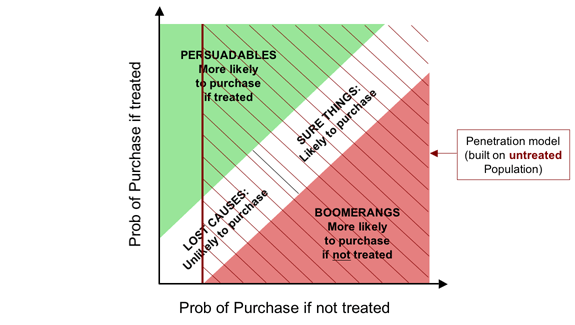
![The soft form of the Fundamental Campaign Segmentation for Demand Generation. The horizontal axis shows probability of purchase if not treated, while the vertical axis shows the probability of purchase if treated. The diagram shows four segments,
- Persuadables (top left) [more likely to purchase if treated];
markedly when treated;
- Lost Causes (bottom left), [unlikely to purchase];
- Sure Things (top right), [likely to purchase]; and
- Boomerangs (bottom right), [more likely to purchase if not treated].](http://farm1.static.flickr.com/145/410223243_8bc2562eb9_o.png)

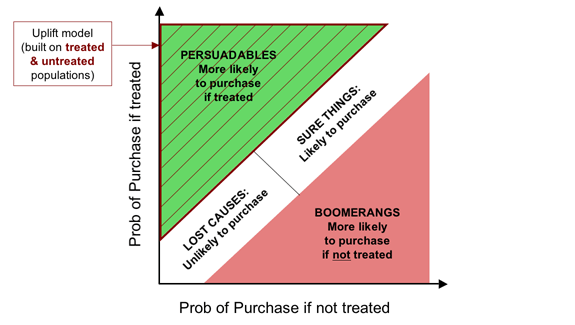
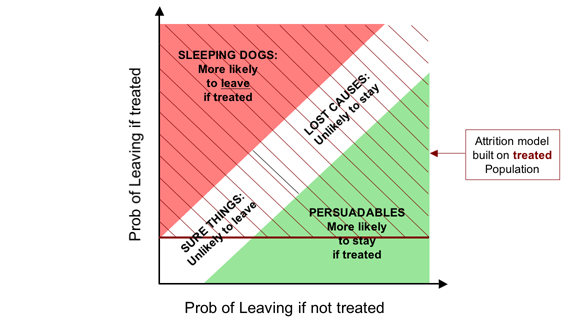
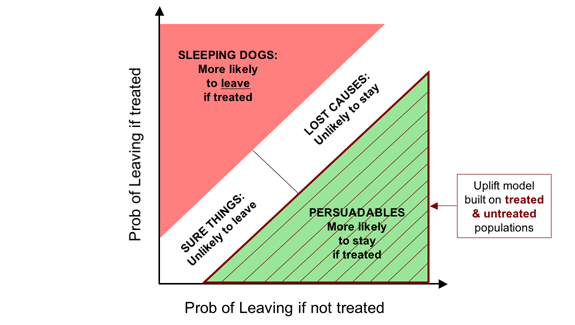
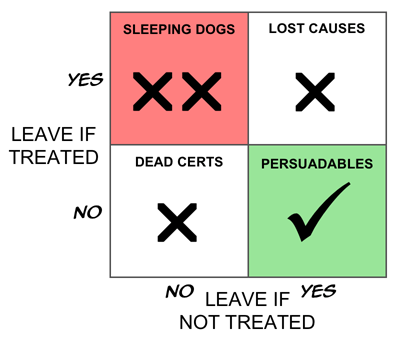
![The soft form of the Fundamental Campaign Segmentation for Retention. The horizontal axis shows probability of leaving if not treated, while the vertical axis shows the probability of leaving if treated. The diagram shows four segments,
- Persuadables (bottom right) [more likely to stay if treated];
markedly when treated;
- Lost Causes (top right), [unlikely to stay];
- Sure Things (bottom left), [likely to leave]; and
- Sleeping Dogs (top left), [more likely to leave if treated].](http://farm1.static.flickr.com/120/410223480_15f744a931_o.png)