1-Pager Available: Customer Savability (Mobile Telco)
posted by njr at 09:18 PERMALINK
![]()
On control groups, lift, direct marketing and analytics . . . mainly
There is a new paper available for download discussing the theory of uplift modelling. It is available here.
This paper, for the first time, details the algorithm that has formed the basis for the uplift models built by the product now known as Portrait Uplift, from Pitney Bowes, and which was originally part of the Decisionhouse software from Quadstone Limited. These uplift models are based on one or more decision trees built using modified split criteria and alternative pruning methods. Because the modified split criterion is based on a significance test, we call the trees Significance-Based Uplift Trees.
The paper also details many of the insights that the Pitney Bowes Business Intelligence team and I have gained over some twelve years of building commercial uplift models, and was written jointly with my long-term collaborator, Patrick Surry.
The paper is called Real-World Uplift Modelling with Significance-Based Uplift Trees and the abstract is below. We hope to publish it in a (peer-reviewed) publication, perhaps in modified form.
This paper seeks to document the current state of the art in ‘uplift modelling’—the practice of modelling the change in behaviour that results directly from a specified treatment such as a marketing intervention. We include details of the Significance-Based Uplift Trees that have formed the core of the only packaged uplift modelling software currently available. The paper includes a summary of some of the results that have been delivered using uplift modelling in practice, with examples drawn from demand-stimulation and customer-retention applications. It also surveys and discusses approaches to each of the major stages involved in uplift modelling—variable selection, model construction, quality measures and post-campaign evaluation—all of which require different approaches from traditional response modelling.
posted by njr at 18:45 PERMALINK
![]()
I'll be speaking about Uplift Modelling at Predictive Analytics World in London on 15th November. The talk abstract is here.

posted by njr at 08:40 PERMALINK
![]()
I'm pleased to announce the availability of a new white paper entitled Generating Incremental Sales: Maximizing the incremental impact of cross-selling, up-selling and deep-selling through uplift modelling.
There is a subtle but important difference between
targeting people who are likely to buy if they are included in a campaign
and
targeting people who are only likely to buy if they are included in a campaign.
It transpires that this single-word distinction is often the difference between a strongly profitable and a severely loss-making campaign. We have seen many cases in which moving to targeting on the second basis (for incremental sales) has more than doubled the extra sales generated by a campaign. Conventional “response” models—despite their name—target on the former basis, and have a marked tendency to concentrate on people who would have bought anyway, thus misallocating marketing resources by increasing costs and failing to maximize sales. This paper discusses the use of a radical new type of predictive modelling—uplift modelling—that allows campaigns to be targeted on the second basis, i.e. so as to maximize incremental sales from cross-sell, up-sell and other sales-generation campaigns.
It's available as a PDF download here (216K, no registration required).
Labels: cross-sell, modelling, text, uplift
posted by njr at 18:26 PERMALINK
![]()
[This is a post that will be updated periodically as more FAQs are added, so if you subscribe to the feed, it may keep re-appearing.]
P (purchase | treatment)
P (purchase | treatment) – P (purchase | no treatment)
| [1] | Using Control Groups to Target on Predicted Lift: Building and Assessing Uplift Models, Nicholas J. Radcliffe, Direct Marketing Journal, Direct Marketing Association Analytics Council, pp. 14–21, 2007. |
Labels: controls, modelling, response, targeting, text, uplift
posted by njr at 20:57 PERMALINK
![]()
Labels: alienation, controls, modelling, negative effects, response, uplift
posted by njr at 12:34 PERMALINK
![]()
In The Fundamental Campaign Segmentation I introduced a theoretical classification of customers according to how their behaviour is affected by a marketing action such as a mailshot. Today I want to look at a softer, more practical version of that segmentation, and use this to look at the rather serious shortcomings of both response models and penetration models.
The “hard” version of the segmentation that I talked about previously depended on knowing whether each customer buys if treated, and also whether she buys if not treated. Such knowledge allows us to talk of “Persuadables”, who buy only if treated, “Sure Things”,1 who buy either way, “Lost Causes”, who don't buy either way, and “Boomerangs”, who only buy if not treated. But of course, we can never know which segment anyone falls into, because we can't both treat and not treat someone.
What we can do more easily, both conceptually and in practice, is to estimate the probability of someone's purchasing when treated, and the corresponding probability of purchasing when not treated. This suggests a “soft” version of the Fundamental Segmentation as follows:
![The soft form of the Fundamental Campaign Segmentation for Demand Generation. The horizontal axis shows probability of purchase if not treated, while the vertical axis shows the probability of purchase if treated. The diagram shows four segments,
- Persuadables (top left) [more likely to purchase if treated];
markedly when treated;
- Lost Causes (bottom left), [unlikely to purchase];
- Sure Things (top right), [likely to purchase]; and
- Boomerangs (bottom right), [more likely to purchase if not treated].](http://farm1.static.flickr.com/145/410223243_8bc2562eb9_o.png)
The horizontal axis shows the probability of purchase if the customer is not treated, while the vertical axis shows the corresponding probability under treatment. A customer who is completely unaffected by the campaign will lie along the centre of the white stripe (the “leading diagonal”). The more positively the action affects the customer's purchase probability, the further toward the top left she will lie on the graph, and conversely, if the action actually reduces her probability of purchase, she will lie further towards the bottom right corner.
Given this framework, it is natural to define soft versions of the segments with boundaries parallel and perpendicular to the diagonal representing “completely unaffected” customers. The key point is that our returns are proportional to the distance from that diagonal (which represents the uplift). Distance from the diagonal towards the top left corner quantifies positive incremental impact (extra sales generated), while distance below and to right represents negative effects (destruction of incremental sales).
Let's look at penetration models through the clarifying lens of our Fundamental Segmentation in its “soft” form. Penetration models simply look at the proportion of people who purchase a product without any particular stimulation. In other words, they model purchase probability without treatment—exactly what we are plotting on the horizontal axis. So let's look at what happens if we target some campaign action on the basis of such a penetration model. The usual practice is to target everyone with a “propensity” above some cutoff, i.e. everyone to the right of some vertical line on the graph. One such is shown on the diagram below.
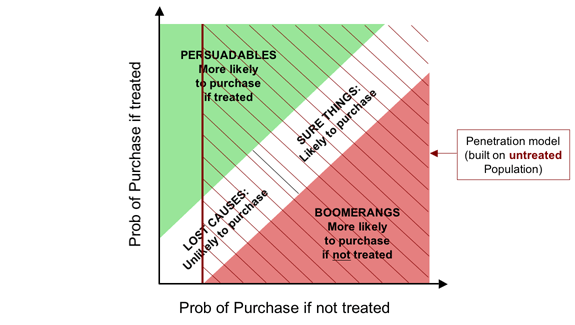
As the diagram makes fairly plain, the problem with penetration models is that they tend to target all of the Boomerangs, thereby actively driving away business, as well as wastefully picking up all of the Sure Things, who would buy anyway. Perhaps more surprisingly, they don't even encourage us to target all of the Persuadables. This is because penetration models are built on an untreated population and have absolutely no information about what would happen if we stimulated these customers.
Clearly, if our goal is to maximize the return on a direct marketing campaign, the last thing we want to do is target on the basis of a penetration model.
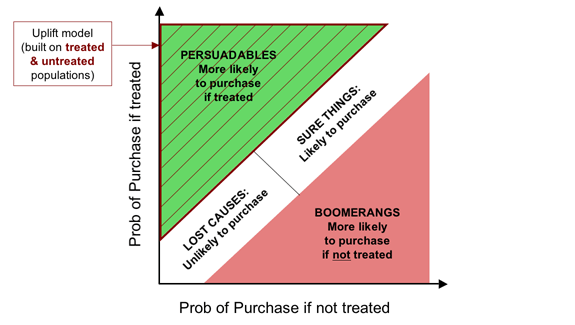
So if penetration models don't look to be doing anything very close to what we want, what about traditional “response” models? The difference between a penetration model and a response model is that where the former is built on an untreated population, the latter is built on a treated population. Assuming, again, that some threshold value is picked for probability of purchase if treated, the impact of targeting with a response model is shown below.

The good news is that the “response” model (so called) does something closer to what we want, while still being far from ideal. On the positive side, it does capture all the Persuadables—the people whose purchase probability is materially increased by our marketing action. On the less positive side, it also targets all the Sure Things (who would have bought anyway) and a good proportion of the Boomerangs, for whom our efforts are counterproductive.
The problem with both penetration models and response models is that they misdirect our targeting efforts by modelling the wrong thing. If our goal is to maximize the incremental business we generate, we would like to target the Persuadables and no one else. If we model uplift—the increase in purchase probability resulting from treatment—this is exactly what we are able to do, regardless of exactly how much “uplift” we require to break even. This is illustrated below.
If our goal is retention, the story is similar, but with some intriguing (and perhaps unexpected) differences.
The soft version of the Fundamental Campaign segmentation for retention presented previously is exactly as you would expect, and is shown here.
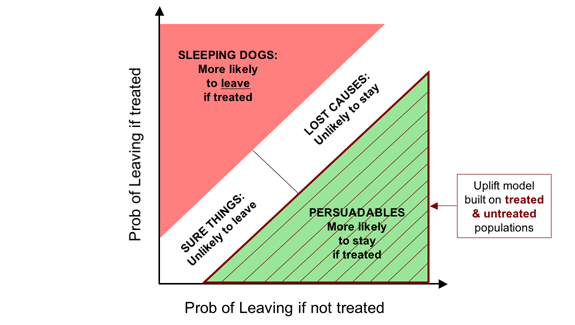
![The soft form of the Fundamental Campaign Segmentation for Retention. The horizontal axis shows probability of leaving if not treated, while the vertical axis shows the probability of leaving if treated. The diagram shows four segments,
- Persuadables (bottom right) [more likely to stay if treated];
markedly when treated;
- Lost Causes (top right), [unlikely to stay];
- Sure Things (bottom left), [likely to leave]; and
- Sleeping Dogs (top left), [more likely to leave if treated].](http://farm1.static.flickr.com/120/410223480_15f744a931_o.png)
The standard approach to model-driven targeting of retention activity is to model the probability that a customer is going to leave and then to target valuable customers thought it identifies as having an unacceptably high risk of leaving.
For applications such as cross-selling, we saw that a response model (built on a treated population) was a significant advance on a penetration model (which is built on a non-treated population). As we shall see, this pattern is reversed for retention.
If we have an established retention programme, the likelihood is that most, if not all, high-risk customers will be subject to retention activity. As a result, when we build our attrition models (churn models), these will usually be based on a population that is largely or entirely made up of customers who have been (at least in the high-risk segments). We can see the effect of targeting on this basis on the overlay below.
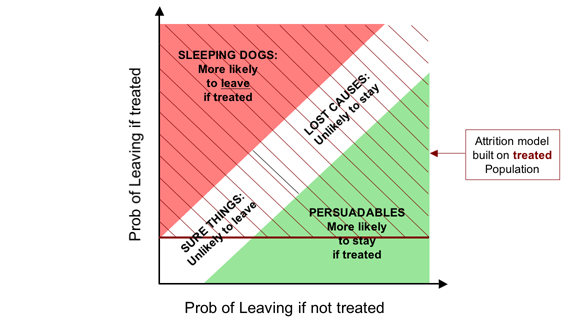
It might at first seem strange that a retention model built on a treated population has exactly analogous failings to a penetration model for demand stimulation: it misses some of the Persuadables, (customers who can be saved, or at least made more likely to stay, by our retention activity) while targeting all Sleeping Dogs (who are driven away by it) as well as many who will go regardless of our actions (the Lost Causes).
As the next overlay shows, if we are going to target on the basis of probability of leaving, it should at least be the probability of leaving if we do nothing. Ironically, this is easiest to achieve if we have a new retention programme, and therefore an untreated population.

So while for demand generation, a response model built on a treated population is somewhat better than a penetration model built on a treated population, this situation is reversed for retention activity: we are better off targeting people based on their probability of leaving if untreated than the corresponding probability when subject to a retention action. And it is particularly important to get this right for retention because most retention activity actually triggers defection for a significant minority of those we try to save (and occasionally a majority).
Needless to say, once again the real solution is to target based on that which actually affects campaign profitability, the incremental effectiveness of the action, or the uplift. We can see this clearly on our final diagram.
As I said before, it is important that we model that which is important, and if our goal is to maximize the incremental impact of our campaigns, that is uplift.
1In fact, the name I used for Sure Things in the previous post was “Dead Certs”, but it seems that is a bit of UK-centric idiom (“cert” being an abbreviation of certain); Sure Things appears a bit more international, i.e. American. ↩
posted by njr at 08:43 PERMALINK
![]()
Statistical credit scoring is almost certainly the earliest example of what we now call CRM analytics. It was largely invented in the 1950s by Fair, Isaac, still one of the leading credit reference agencies in the world.
This post is the first of a short series that will talk about the nature of credit scorecards and explain how, behind their deceptive simplicity, there is a remarkably sophisticated modelling methodology that is competitive with just about anything else in use in mainstream predictive modelling today.
But first, a story.
Probably ten years ago, or more, I met a woman called Mary Hopper, who had worked for Fair, Isaac for many years. She told the following story, which still stands as a salutary reminder of how difficult our messages can be to get across.
Many years previously, Mary had found herself giving a presentation to the board of a bank, in which she tried to persuade them to adopt the then new-fangled statistical approach to determining lending decisions. She had done some analysis, which showed that in segment A, to which she was recommending offering credit, only one in twenty people would default. In contrast, in segment B, where she recommended refusing credit, the rate of default would be more like one in eight. She had graphs and diagrams and tables, all of which conclusively proved (so far as statistics and models ever conclusively prove anything) that segment A was the better bet.
The members of the board listened politely, as was the custom of that halcyon era, and when she had finished, feeling rather pleased with her own performance, the bank's chairman thanked her. He assured Mary that her presentation had been extremely clear, and very convincing. He had just one minor improvement to suggest. This was that rather than lending to the whole of segment A, the bank should instead lend only to the 19 out of 20 who would, in fact, pay them back.
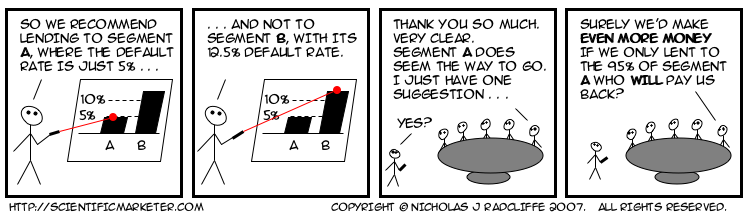
My bet is this story has repeated itself hundreds if not thousands of times since.
Stories aside, I'll finish this post with a simple description of a modern scorecard. While practices vary, most credit scores today are produced using a model with a form extremely similar to that which I will describe below.
A (consumer) credit score is a number. Conventionally, the higher the number, the better an individual's credit-worthiness. They can be scaled different ways, but perhaps the most common way is to scale them so that scores mostly lie between zero and a thousand. Each score can be mapped simply, and unambiguously, to a probability of default using a simple function.
There is a fundamental distinction between so-called application scores and so-called behaviour scores. Application scores are used when a new customer applies for a credit product with a lending organization. Because the customer is new, the lender has less information available on which to make a decision, so the main factors tend to be a mixture of questions on application forms and information that can be purchased from credit reference agencies. In contrast, behaviour scores are used to estimate the credit quality of existing customers, both for day-to-day management and monitoring purposes (including allocation of capital) and also for deciding whether to extend further lines of credit to particular individuals.
The score is formed by adding up a set of component scores. Each component can be thought of as representing some fact about the customer, and is conventionally known (in terminology popularized by Fair, Isaac) as a characteristic. Stability indicators often form a major component of scorecards, so common characteristics are things like “time in job”, and “time at this address”.
For behavioural scorecards, the emphasis tends to be much more strongly on characteristics that summarize different aspects of the individual's transactional behaviour and account management. These include things like account trends (is the balance increasing or decreasing), swings (how stable is the balance), and other key indicators such as “largest single credit transaction”.
In the most common case, the possible values for each characteristic are grouped into bands (known as attributes), and each band attracts a number of points. The customer's score is then simply formed by adding up the points for each characteristic in the scorecard.
Thus a simple scorecard might look like this.
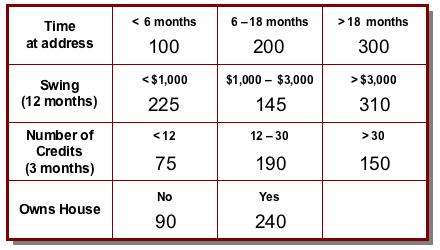
So, for example, a customer who has lived at her address for 16 months, has a 12-month swing on her account (the difference between the highest and lowest balance during that period) of $900, saw 22 credits on the account in the last 3 months and rents her house would get a score of 200 + 225 + 190 + 90 = 705.
Clearly, the scorecard is a pretty simple mechanism for coming up with a score, even if in practice there might typically be a few more characteristics, and perhaps also a few more possible values for many of them. In fact, at first glance, this might look a little too simple. Surely just adding up a bunch of component scores is a trivial way of predicting something. What about non-linearities? How could such a transparently unsophisticated system possibly compete with the subtleties of something like a neural network?
Over the next two or three posts on this thread, I'll be talking through these and other issues and showing, among other things, that beguilingly simple as it is, a state-of-the-art “numbers-in-boxes” scorecard combines extreme flexibility of modelling with a quite surprising ability to model non-linear behaviour; in fact, it is competitive with just about any other current predictive technique. Topics will include linearity (scalar multiplication and additivity) variable transformation, interactions, segmentation, binning and more.
Watch this space!
posted by njr at 22:25 PERMALINK
![]()

It's pretty obvious the distribution of matter in space is lumpy. Matter clumps into planets, planets orbit stars, stars clump into galaxies, galaxies group together into clusters, and―wouldn't you know it―clusters form superclusters. Thank gravity for that. There are clumps of matter, and other things, at smaller scales too. Atoms are mostly empty space, with a lot of stuff at the centre (the nucleus), and electrons like to hang around at particular distances away from the nucleus (the shells), though it's hard to pin them down. Similarly, people clump together on the Earth. London, Tokyo and Sao Paulo are pretty crowded; the Sahara, the Highlands of Scotland and central Australia mostly aren't. (People are quite hard to pin down, too.)
Cluster analysis is a set of techniques for taking the coordinates of a lot of objects (stars, particles, people…) and figuring out something about where the lumps are. There are lots of ways to do it.
Someone, deep in the mists of time, had the bright idea of applying cluster analysis to customers to figure out “where the clumps are”. The idea wasn't to use geographical coordinates (of their houses, say), but to replace coordinates with customer characteristics, like demographics (age, income etc.), behavioural measurements (spend levels, frequencies, balances etc.), and maybe attitudinal things like psychographics. That way, they thought, they might uncover the “natural groupings” of customers, which could be useful for understanding their dynamics and for segmenting them.
While it was far from a stupid idea, it turns out that it was an extremely bad idea, one that at best has wasted countless thousands of hours of analyst time, and at worst has led to baseless conclusions and highly suboptimal marketing.
There are far too many problems to do justice to in a single blog post, so I won't. Instead, I'll list some headlines here, and over the coming weeks I'll do an entry on each one. Then maybe I'll gather them into an absurdly long whole.
Here are some of the headline reasons that clustering customer characteristics isn't useful.
For avoidance of doubt (as lawyers say), and notwithstanding the impression the title of this entry may give, the problem isn't cluster analysis per se, which is a perfectly fine collection of techniques. If you want to find the clumps in a low-dimensional space with commensurate dimensions, it's exactly what you need. It's just that that isn't a very good description of a customer base.
Here are the parts posted so far:
Labels: clustering, modelling, text
posted by njr at 17:02 PERMALINK
![]()