[This is a post that will be updated periodically as more FAQs
are added, so if you subscribe to the feed, it may keep re-appearing.]
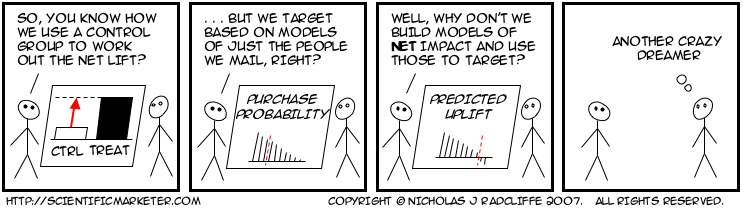
- Q. What is Uplift Modelling?
A. Uplift modelling is a way of predicting
the difference that an action makes to the behaviour
of someone.
Typically, it is used to predict the change in purchase
probability, attrition probability, spend level or risk
that results from a marketing action such as sending a
piece of mail, making a call to someone, or changing
some aspect of the service that the customer receives.
- Q. Uplift Modelling sounds like Response Modelling.
How is it different?
A. Ordinary "response" modelling actually doesn't model
a change in behaviour
(even though it sounds as if it should):
it models the behaviour of someone who is subject to some
influence.
Uplift models instead model the change in behaviour
that results when someone is subject to an
influence—typically, how much more that person spends,
how much less likely (s)he is to leave etc.
Mathematically, a response model predicts something like
P (purchase | treatment)
("the probability of purchase given some specific treatment",
such as a mailing),
whereas an uplift model predicts
P (purchase | treatment) – P (purchase | no treatment)
("the difference between the probability of purchase
given some specific treatment and the corresponding
probability if the customer is not subject to that treatment").
-
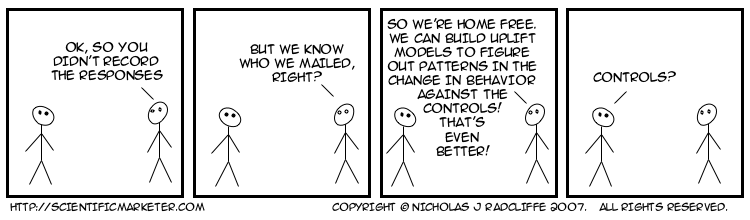
Q. Uplift modelling sounds like Voodoo.
How can it possibly know the change in behaviour of a
single individual?
A. Uplift modelling can't know the change
in behaviour for any individual, any more than a normal model can
know the behaviour of an individual in a future.
But it can predict it.
It does this by looking at two groups of people, one of which
was subject to the marketing action in question,
and the other of which was not (a control group).
Just as it is standard to measure the
incrementality of a campaign by looking
at the overall difference in purchase rate between the treated
group and an otherwise equivalent control group,
uplift modelling models the difference in behaviour between
these two groups, finding patterns in the variation.
-
Q. Does Uplift Modelling Really Work?
A. Uplift modelling can work, and has been
proven to do so with in-market tests.
Uplift models are harder to build than conventional models,
because they predict a second-order effect—usually the
difference between two probabilities.
This means that the error bars tend to be larger than for
conventional models, and sometimes there is simply not enough
signal for current techniques to model accurately.
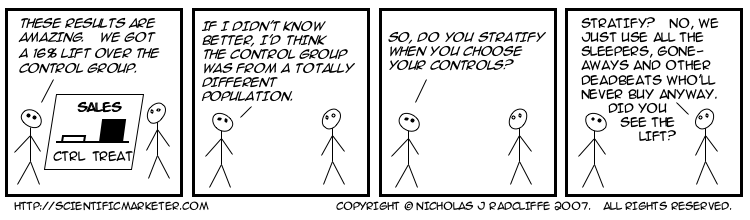
This is especially true when, as if often the case, the control
group is small.
-
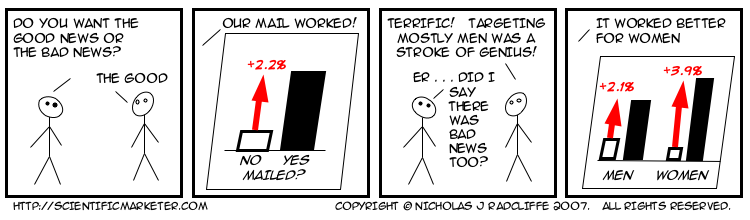
Q. When does uplift modelling predict different things from non-uplift models?
A. It's perhaps easier to say when they predict the
same thing. This is usually when there is essentially no behaviour
in the control group. For example, if a set of people purchase
product X after a mailing, but no one purchases it without the
mailing, and uplift model should predict the same thing as a
conventional response model.
Their predictions are most different when the variation in the
change in behaviour opposite from the variation in the underlying
behaviour. For example, suppose the background purchase pattern
(the one you see if you don't do anything) is that mostly men by
product X, but the effect of a marketing action is to make more
women buy it, but fewer men, even though still more men than
women buy when treated.
In this case, uplift models will make radically different
different predictions from "response" models.
A response model will concentrate on the fact that more
men buy (when treated) that women; but an uplift model will
recognize that women's purchases are increased by the treatment
whereas men's is suppressed.
-
Q. How do you measure the quality of an uplift
model?
A. Standard quality measures for models
(such as gini, R-square, classification error etc.)
don't work for uplift models as they are all based on
comparing an actual, known outcome for an individual
with a predicted outcome.
However, since a single person can't be simultaneously
treated and not-treated, we can't make this comparison.
There is, however, a generalization of the gini measure
called Qini that has some of the
characteristics as gini, but which does apply to uplift
models.
This has been described in the paper referenced as [1].
-
Q. What are the main application so of uplift modelling?
A. So far the biggest successes with uplift
modelling have been in the areas of customer retention
and demand generation (cross-sell and up-sell, particularly).
The state-of-the-art approach to customer retention
is to predict which customers are at risk of attrition
(or "churn") and then to target those at high risk
who are also of high value with some retention activity.
Unfortunately, such retention efforts quite often backfire,
triggering the very attrition they were intended to save.
Uplift models can be used to identify the people who can
be saved by the retention activity.
There's often a triple win, because you reduce triggered
attrition (thus increasing overall retention),
reduce the volume targeted (and thus save money)
and reduce the dissatisfaction generated by those who
don't react well to retention activity.
The other big successes have come in the area of
cross-sell and up-sell, particularly of high-value
financial products. Here, purchase rates are often low,
and the overall incremental impact of campaigns is often small.
Uplift modelling often allows dramatic reduction in the volumes
targeted while losing virtually no sales.
In some case, where negative effects are present,
incremental sales actually increase despite a lower
targeting volume.
-
Q. Are there any disadvantages of uplift modelling?
A. Uplift modelling is harder and requires valid
controls groups to be kept, which have to be of reasonable size.
Experience shows that it is also easy to misinterpret the
results of campaigns when assessing uplift, especially when
it is first adopted.
Adoption of uplift models usually results in reductions in
contact volumes, which is sometimes seen as a negative by
marketing departments.
An uplift modelling perspective also often reveals that previous
targeting has been poor, and sometimes brings to light negative
effects that had not previously been identified.
There is also some evidence that uplift models also seem to need
to be refreshed more frequently than conventional models,
and there are clearly cases where either data volumes are not
adequate to support uplift modelling or where the results of
uplift modelling are not significantly different from those
of conventional modelling.
Anecdotally, this seems to be the case in the retail sector
more than in financial services and communications.
-
Q. How does uplift modelling relate to incremental modelling?
A. It's the same thing.
Various people have apparently independently come up with the
idea of modelling uplift, and different statistical approaches to it.
There is no broad agreement on terminology yet.
Names include
- uplift modelling
- differential response analysis
- incremental modelling
- incremental impact modelling
- true response modelling
- true lift modelling
- proportional hazards modelling
- net modelling.
These are all the essentially the same thing.