Uplift and Lift: Not the Same Thing at All
A lot of this blog is about Uplift. You may wonder why I use an ugly, slightly redundant term like uplift when marketers normally talk simply about lift. The reason is that they are completely different.
Lift is a measure of targeting effectiveness that tells you how much better than random your targeting is. The idea is simple. Suppose you get a 1% purchase rate if you target randomly, and a 3% purchase rate if you target only segment A. Then the lift is 3% / 1% = 3. If you have a score (say, purchase probability) then you can plot lift as a function of volume targeted (starting with the best customers), and it will look something like this (assuming your score allows better-than-random targeting):
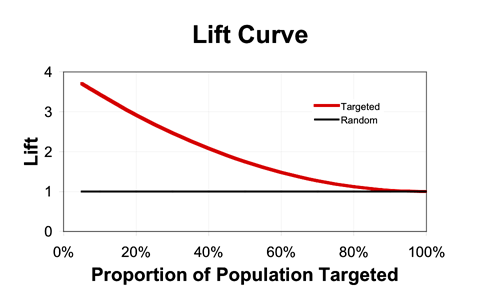
Lift curves show the same information as Gains Charts (with which they are often confused) but display it in a different way. And they always end at 1 because of course if you target the whole population, you get the same response rate as if you target randomly (on average).
In contrast, uplift directly measures the (additive) difference between the expected outcome in a treated group and control group. For a binary outcome, such as purchase, this is
P (purchase | treatment) – P (purchase | no treatment).
For a continuous outcome, such as spend, this is
E (spend | treatment) – E (spend | no treatment).
So in summary,
- Lift measures the effectiveness of targeting. It quantifies how much better the outcomes are in a target group than they would be in a randomly chosen group (multiplicatively: 2 = twice as good).
- Uplift quantifies the effectiveness of treatment. It measures the difference in outcome between a treated group and an equivalent non-treated group (additively: 10% uplift means that if a person's probability of purchase without treatment is 5%, with treatment it's 15%.) Strictly, uplift for binary outcomes is measured in percentage points, while for continuous outcomes, e.g. incremental spend, uplift is simply the difference in expected spend between the treated and non-treated group.
Labels: measurement, response, text, uplift
posted by njr at 08:21 PERMALINK
![]()
<< Home