The Deceptive Simplicity of Scorecards
Statistical credit scoring is almost certainly the earliest example of what we now call CRM analytics. It was largely invented in the 1950s by Fair, Isaac, still one of the leading credit reference agencies in the world.
This post is the first of a short series that will talk about the nature of credit scorecards and explain how, behind their deceptive simplicity, there is a remarkably sophisticated modelling methodology that is competitive with just about anything else in use in mainstream predictive modelling today.
But first, a story.
Probably ten years ago, or more, I met a woman called Mary Hopper, who had worked for Fair, Isaac for many years. She told the following story, which still stands as a salutary reminder of how difficult our messages can be to get across.
Many years previously, Mary had found herself giving a presentation to the board of a bank, in which she tried to persuade them to adopt the then new-fangled statistical approach to determining lending decisions. She had done some analysis, which showed that in segment A, to which she was recommending offering credit, only one in twenty people would default. In contrast, in segment B, where she recommended refusing credit, the rate of default would be more like one in eight. She had graphs and diagrams and tables, all of which conclusively proved (so far as statistics and models ever conclusively prove anything) that segment A was the better bet.
The members of the board listened politely, as was the custom of that halcyon era, and when she had finished, feeling rather pleased with her own performance, the bank's chairman thanked her. He assured Mary that her presentation had been extremely clear, and very convincing. He had just one minor improvement to suggest. This was that rather than lending to the whole of segment A, the bank should instead lend only to the 19 out of 20 who would, in fact, pay them back.
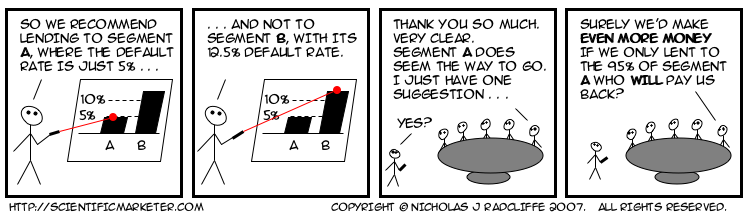
My bet is this story has repeated itself hundreds if not thousands of times since.
The Deceptive Simplicity of Scorecards
Stories aside, I'll finish this post with a simple description of a modern scorecard. While practices vary, most credit scores today are produced using a model with a form extremely similar to that which I will describe below.
A (consumer) credit score is a number. Conventionally, the higher the number, the better an individual's credit-worthiness. They can be scaled different ways, but perhaps the most common way is to scale them so that scores mostly lie between zero and a thousand. Each score can be mapped simply, and unambiguously, to a probability of default using a simple function.
There is a fundamental distinction between so-called application scores and so-called behaviour scores. Application scores are used when a new customer applies for a credit product with a lending organization. Because the customer is new, the lender has less information available on which to make a decision, so the main factors tend to be a mixture of questions on application forms and information that can be purchased from credit reference agencies. In contrast, behaviour scores are used to estimate the credit quality of existing customers, both for day-to-day management and monitoring purposes (including allocation of capital) and also for deciding whether to extend further lines of credit to particular individuals.
The score is formed by adding up a set of component scores. Each component can be thought of as representing some fact about the customer, and is conventionally known (in terminology popularized by Fair, Isaac) as a characteristic. Stability indicators often form a major component of scorecards, so common characteristics are things like “time in job”, and “time at this address”.
For behavioural scorecards, the emphasis tends to be much more strongly on characteristics that summarize different aspects of the individual's transactional behaviour and account management. These include things like account trends (is the balance increasing or decreasing), swings (how stable is the balance), and other key indicators such as “largest single credit transaction”.
In the most common case, the possible values for each characteristic are grouped into bands (known as attributes), and each band attracts a number of points. The customer's score is then simply formed by adding up the points for each characteristic in the scorecard.
Thus a simple scorecard might look like this.
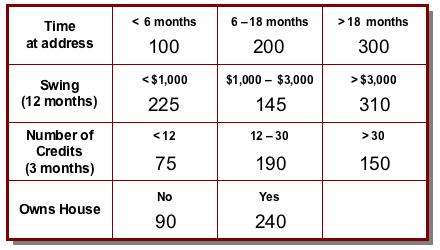
So, for example, a customer who has lived at her address for 16 months, has a 12-month swing on her account (the difference between the highest and lowest balance during that period) of $900, saw 22 credits on the account in the last 3 months and rents her house would get a score of 200 + 225 + 190 + 90 = 705.
Clearly, the scorecard is a pretty simple mechanism for coming up with a score, even if in practice there might typically be a few more characteristics, and perhaps also a few more possible values for many of them. In fact, at first glance, this might look a little too simple. Surely just adding up a bunch of component scores is a trivial way of predicting something. What about non-linearities? How could such a transparently unsophisticated system possibly compete with the subtleties of something like a neural network?
Over the next two or three posts on this thread, I'll be talking through these and other issues and showing, among other things, that beguilingly simple as it is, a state-of-the-art “numbers-in-boxes” scorecard combines extreme flexibility of modelling with a quite surprising ability to model non-linear behaviour; in fact, it is competitive with just about any other current predictive technique. Topics will include linearity (scalar multiplication and additivity) variable transformation, interactions, segmentation, binning and more.
Watch this space!
posted by njr at 22:25 PERMALINK
![]()
<< Home